Data Visualization with Svelte and D3.js
| Kristijan BarišićCreating Interactive Data Visualizations with Svelte and D3.js
Introduction
In today's digital age, effective data visualization is essential for communicating complex information. In this blog post, we'll explore how to combine the power of Svelte and D3.js to craft engaging and interactive data visualizations.
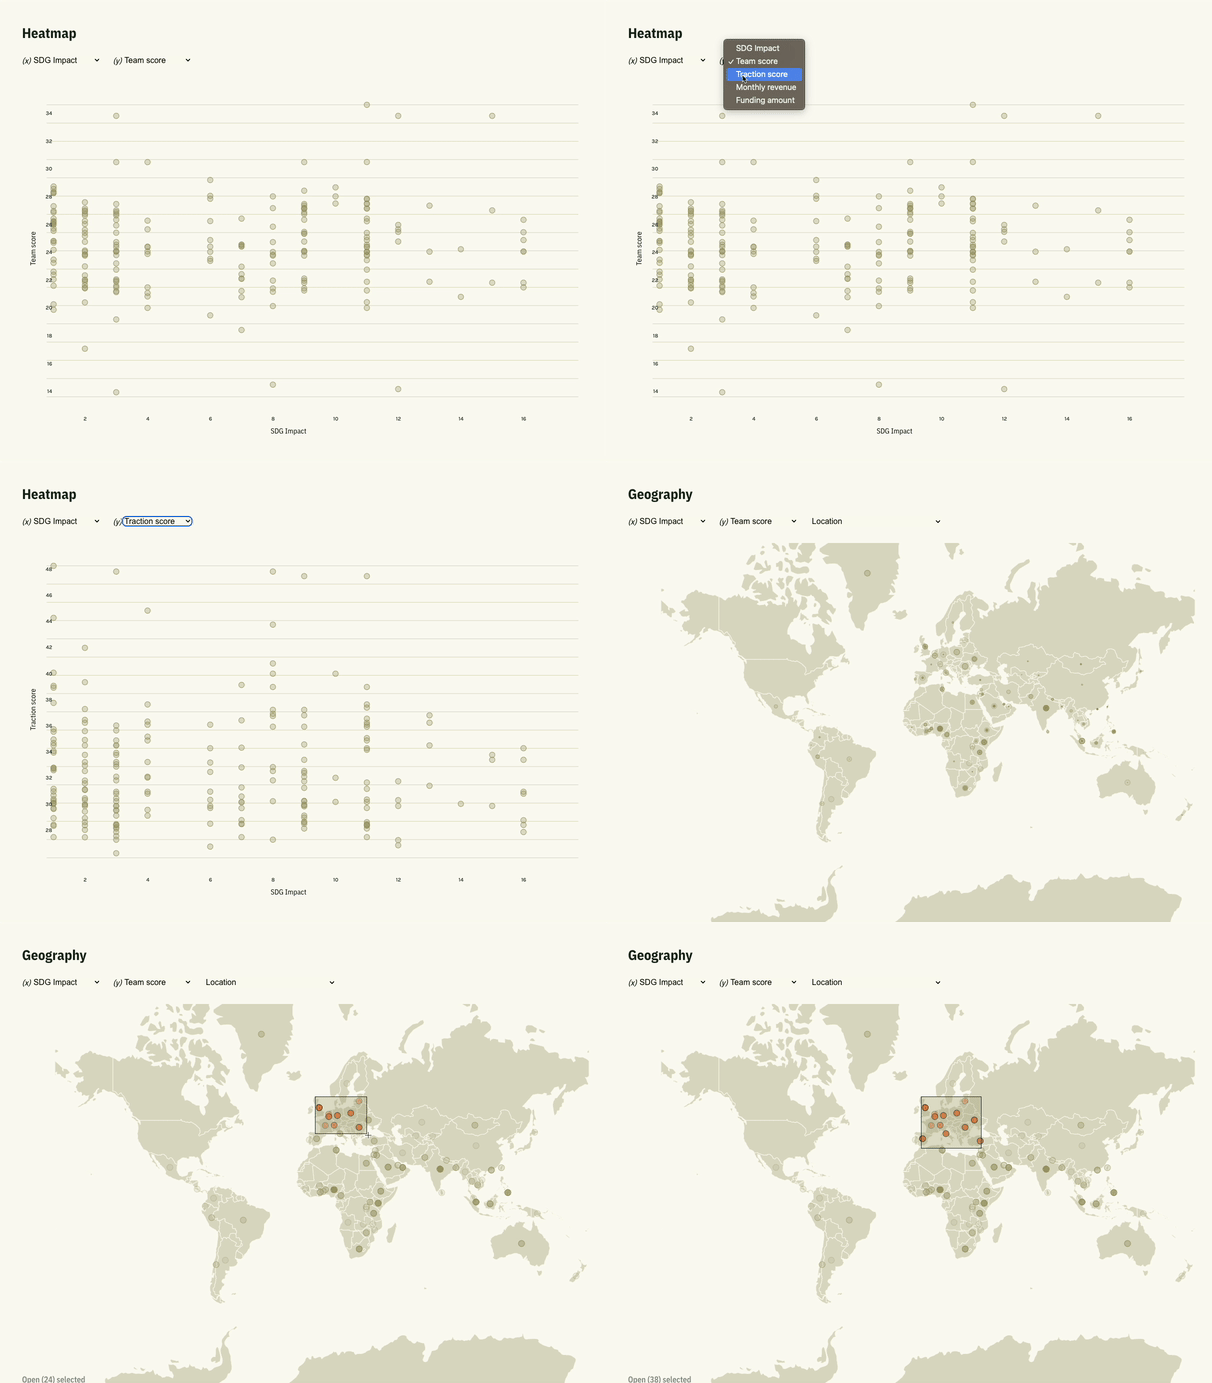
In our recent project called AI Start combining D3.js with Svelte opened the door for us to present data in a simple visual format, giving users more interactive way to search through the data.

Why Choose Svelte for Data Visualization?
Svelte is a modern JavaScript framework used for building user interfaces. It is designed to be highly efficient and compiles components into highly optimized vanilla JavaScript during build time. Svelte focuses on simplicity and performance. It uses a reactive paradigm, where components update in response to changes in data without the need for a virtual DOM. Svelte is well-suited for creating dynamic and interactive user interfaces.

Why Incorporate D3.js?
D3 is a powerful JavaScript library for creating dynamic, interactive data visualizations using HTML, CSS, and SVG. It provides tools for binding data to the DOM and manipulating the DOM based on the data. D3 is commonly used for creating charts, graphs, maps, and other data visualizations. It gives fine-grained control over the appearance and behavior of visual elements.
Setup
Click here to see the project setup
Create Svelte project:
The simplest way to create Svelte project is with Vite by running command:
npm create vite@latest
# In Vite installation menu select the svelte option and follow the instructions.
Install dependencies:
npm install d3
npm install d3-geo
Building Your First Svelte Component with D3.js
Here's an example of how you might integrate D3.js to Svelte component
BarChart.svelte:
<!-- BarChart.svelte -->
<script>
  // Import necessary Svelte functions and D3 library
  import {onMount} from 'svelte';
  import * as d3 from 'd3';

  // Data array for the bar chart
  let data = [7, 15, 23, 10, 18, 30, 5];

  // Function to set up the chart on component mount
  onMount(() => {
    // Select the chart container and append an SVG element
    const svg = d3
      .select('.chart-container')
      .append('svg')
      .attr('width', '100%')
      .attr('height', 200);

    // Define the width of each bar
    const barWidth = 25;

    // Bind data to rectangles and create the bars
    svg
      .selectAll('.bar')
      .data(data)
      .enter()
      .append('rect')
      .attr('class', 'bar')
      .attr('x', (d, i) => i * (barWidth + 5)) // Calculate x position for each bar
      .attr('y', d => 200 - d * 10) // Calculate y position for each bar
      .attr('width', barWidth) // Set the width of each bar
      .attr('height', d => d * 10) // Set the height of each bar
      .attr('fill', '#007acc'); // Set the fill color of each bar
  });
</script>

<!-- Container for the chart -->
<div class="chart-container"></div>

<style>
  /* Styles for the chart container */
  .chart-container {
    margin: 20px;
  }
</style>
Adding Interactivity and Enhancing UX
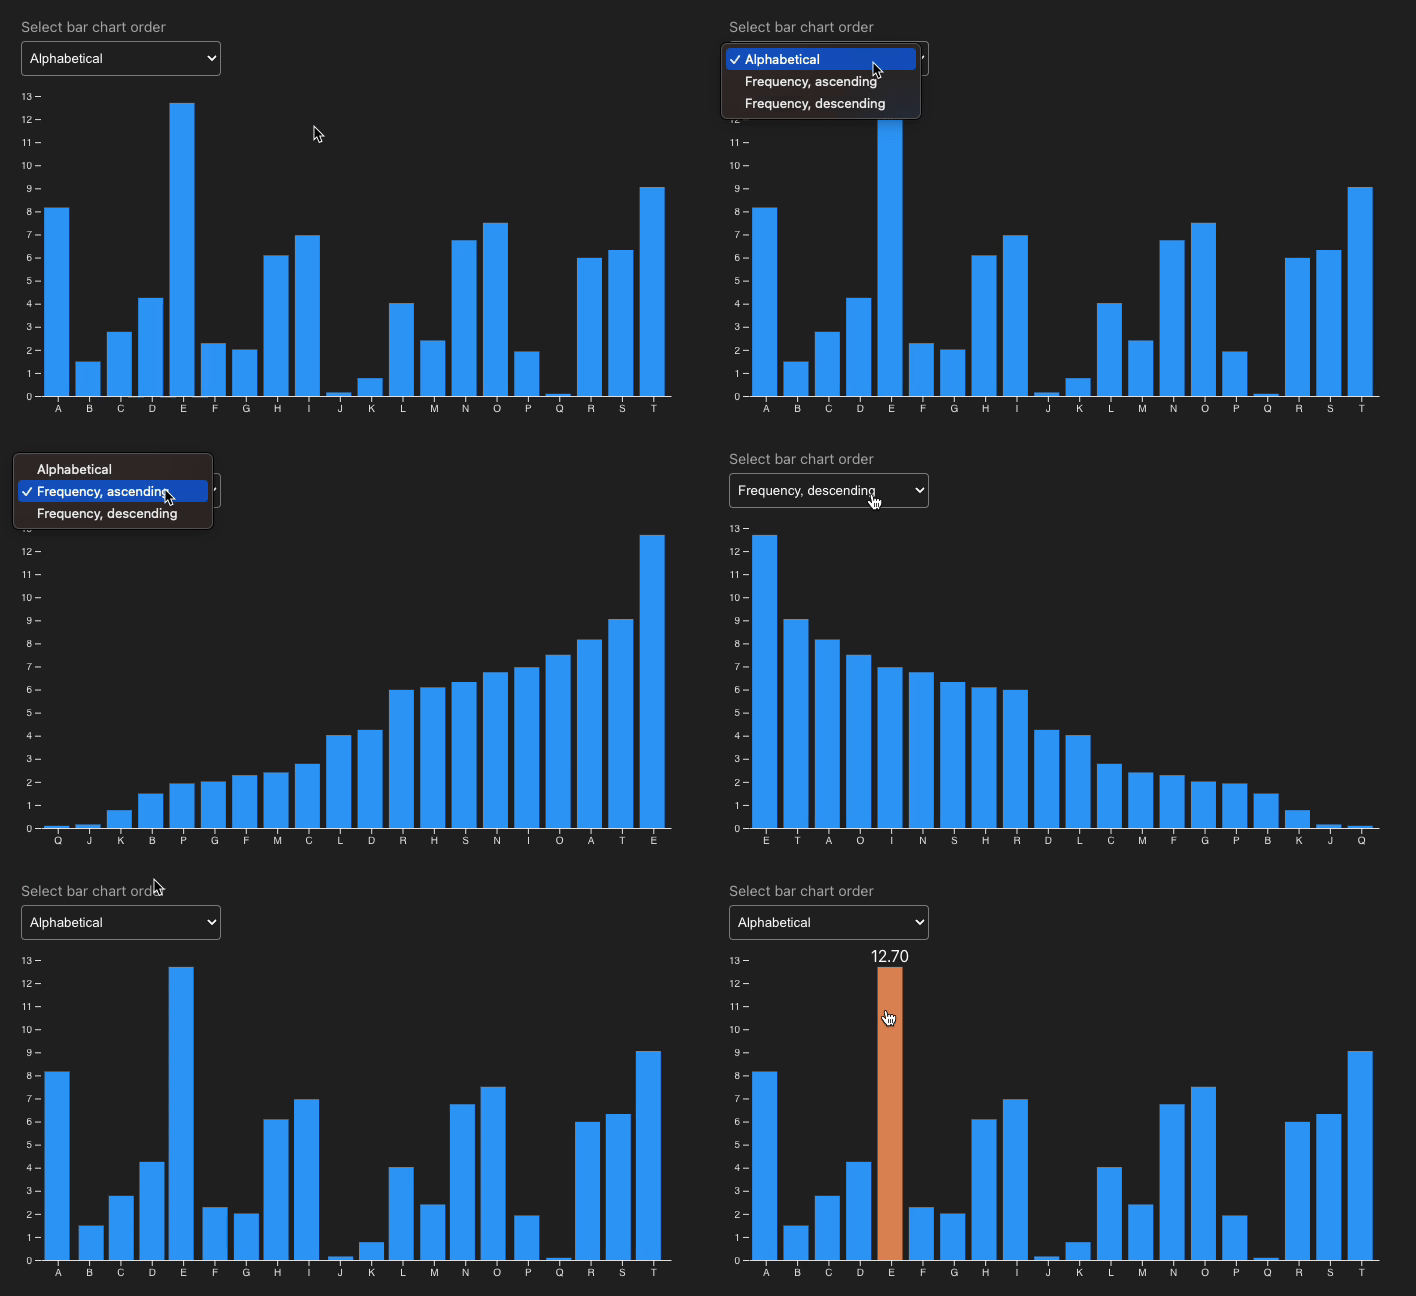
Interactivity is key in data visualization. With Svelte's event handling, adding interactions is a breeze. Here's an example of highlighting data points on hover:
<!-- BarChart.svelte -->
<script>
  // Import necessary modules from Svelte and D3.js
  import {onMount} from 'svelte';
  import * as d3 from 'd3';

  // Data for the bar chart
  let data = [7, 15, 23, 10, 18, 30, 5];

  // Execute code when the component is mounted
  onMount(() => {
    const svgWidth = '100%'; // Width of the SVG container
    const svgHeight = 300; // Height of the SVG container
    const barWidth = 25; // Width of each bar
    const topPadding = 50; // Padding at the top of the SVG

    // Select the chart container and append an SVG element
    const svg = d3
      .select('.chart-container')
      .append('svg')
      .attr('width', svgWidth)
      .attr('height', svgHeight + topPadding);

    // Create bars based on the data
    svg
      .selectAll('.bar')
      .data(data)
      .enter()
      .append('rect')
      .attr('class', 'bar')
      .attr('x', (d, i) => i * (barWidth + 5)) // Position each bar horizontally
      .attr('y', d => svgHeight - d * 10 + topPadding) // Position each bar vertically
      .attr('width', barWidth) // Set the width of each bar
      .attr('height', d => d * 10) // Set the height of each bar
      .attr('fill', '#007acc') // Set the fill color of bars
      .on('mouseover', function (event, d) {
        d3.select(this).attr('fill', '#ff6347'); // Change color on hover

        // Show value as tooltip
        const tooltip = svg
          .append('text')
          .attr('class', 'tooltip')
          .attr('x', parseFloat(this.getAttribute('x')) + barWidth / 2)
          .attr('y', parseFloat(this.getAttribute('y')) - 5)
          .attr('text-anchor', 'middle')
          .style('fill', '#808080')
          .text(d);
      })
      .on('mouseout', function () {
        d3.select(this).attr('fill', '#007acc'); // Restore original color

        // Remove tooltip on mouseout
        svg.select('.tooltip').remove();
      });
  });
</script>

<!-- Container for the chart -->
<div class="chart-container"></div>

<style>
  /* Styles for the chart container */
  .chart-container {
    height: 350px;
    margin: 20px;
    display: flex;
    align-items: flex-end; /* Align SVG to the bottom */
  }

  /* Styling for the tooltip */
  .tooltip {
    font-size: 12px;
    font-weight: bold;
  }
</style>
More examples
You can take a look at our public Github repository where you can find this examples and more complex charts.
Performance Best Practices
Optimizing performance for large datasets is essential. Svelte's inherent optimizations and D3.js best practices can significantly enhance rendering speed. Use techniques such as data aggregation, proper scale usage, and minimizing DOM updates.
Conclusion
Combining the strengths of Svelte and D3.js empowers developers to create impactful and interactive data visualizations. By harnessing Svelte's reactivity and D3's data manipulation capabilities, you can bring your data to life and captivate your audience with informative and engaging visual experiences.